Project: Credit Suisse to UBS trade Migration
Client: UBS internal Pitch
Company: EPAM
Date: June 2023
Skills used: Leading workshops, UX design, Team leadership, AI, Innovation strategy, Story telling
The problem: To open up conversations with an existing client UBS, Myself and a UI designer were asked to create a vision of a trading portal that would help monitore the migration of shares from Credit Suisse to the UBS platform.
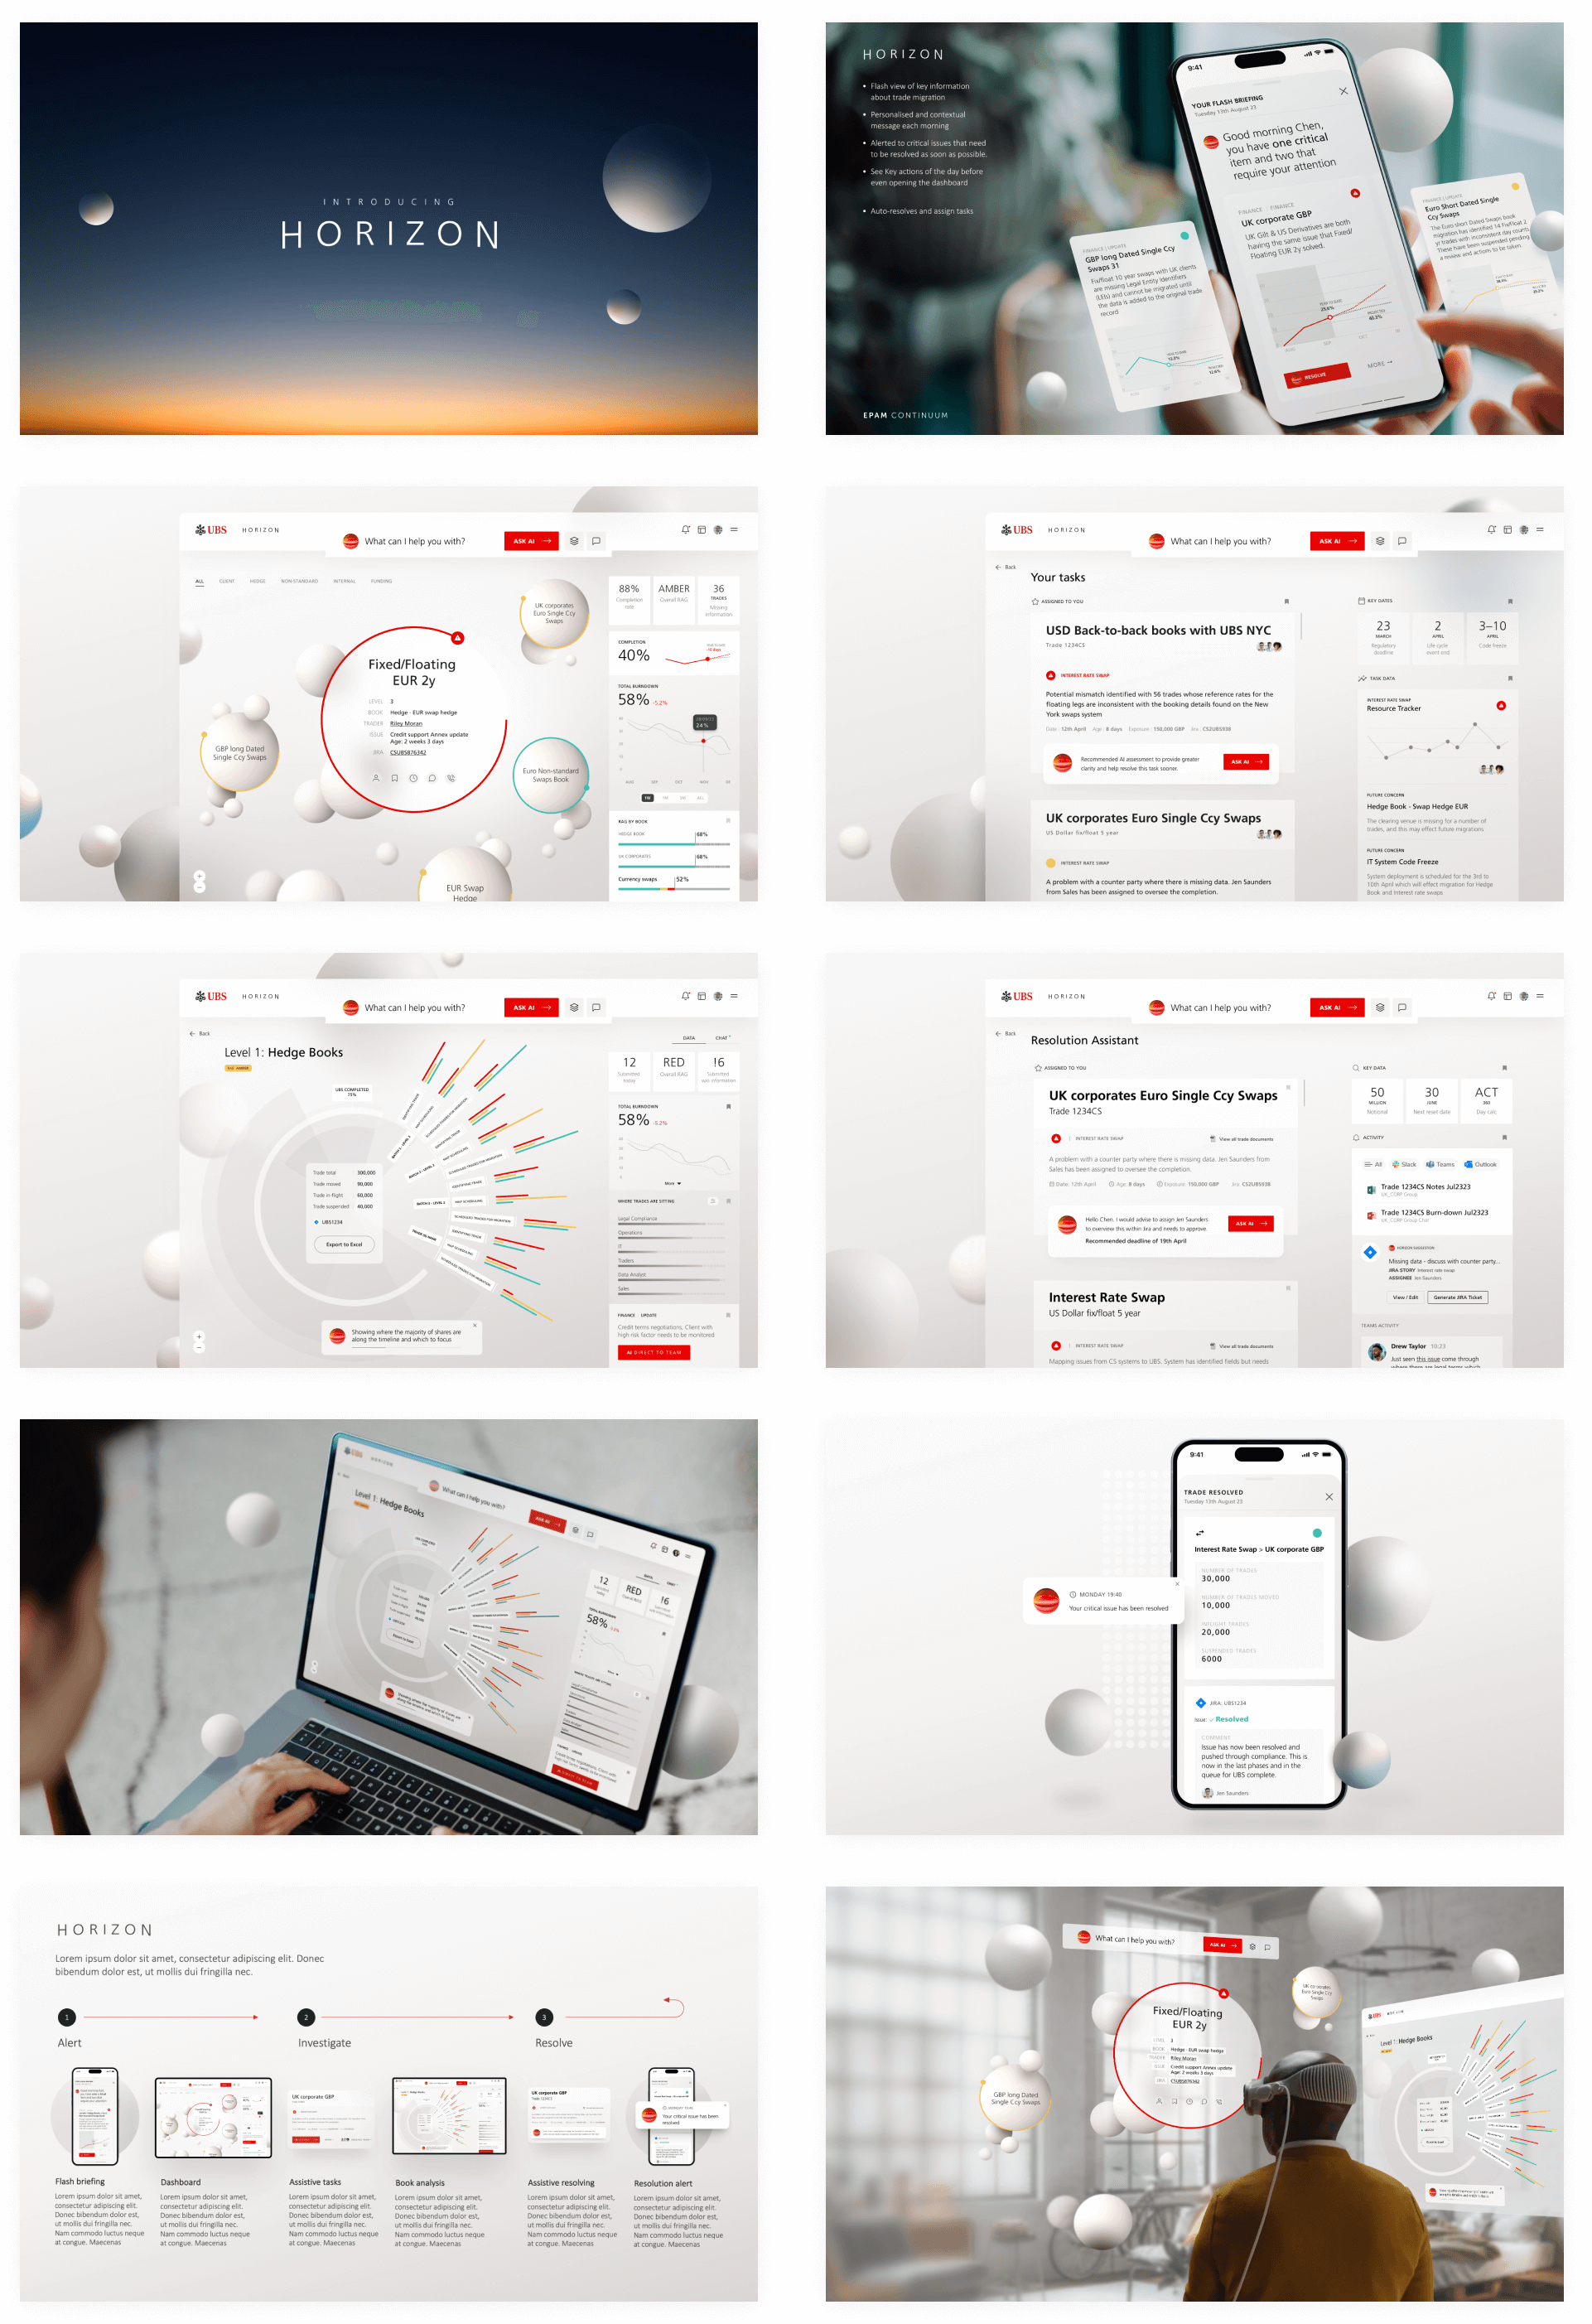
Solution: Here it was very much a start of a conversation, so what was need was creating a talking point, and to showcase not only the design skills within EPAM but also what could be achieved from a developpment perspective. Using AI to produce the graphs from the users request, and highlighting areas that needed instant attention.
Brief
Speaking with the the VP for Financial Services and Director of digital engagement to understand what what was required from them. This to understand not only the vision in their heads and what examples they could think of, but to understand how they were thinking of presenting this vision and what message they were trying to portray. Along with understanding who would be using the tool in terms of personas, but also who would be watching the completed presentation.
Creating a narrative
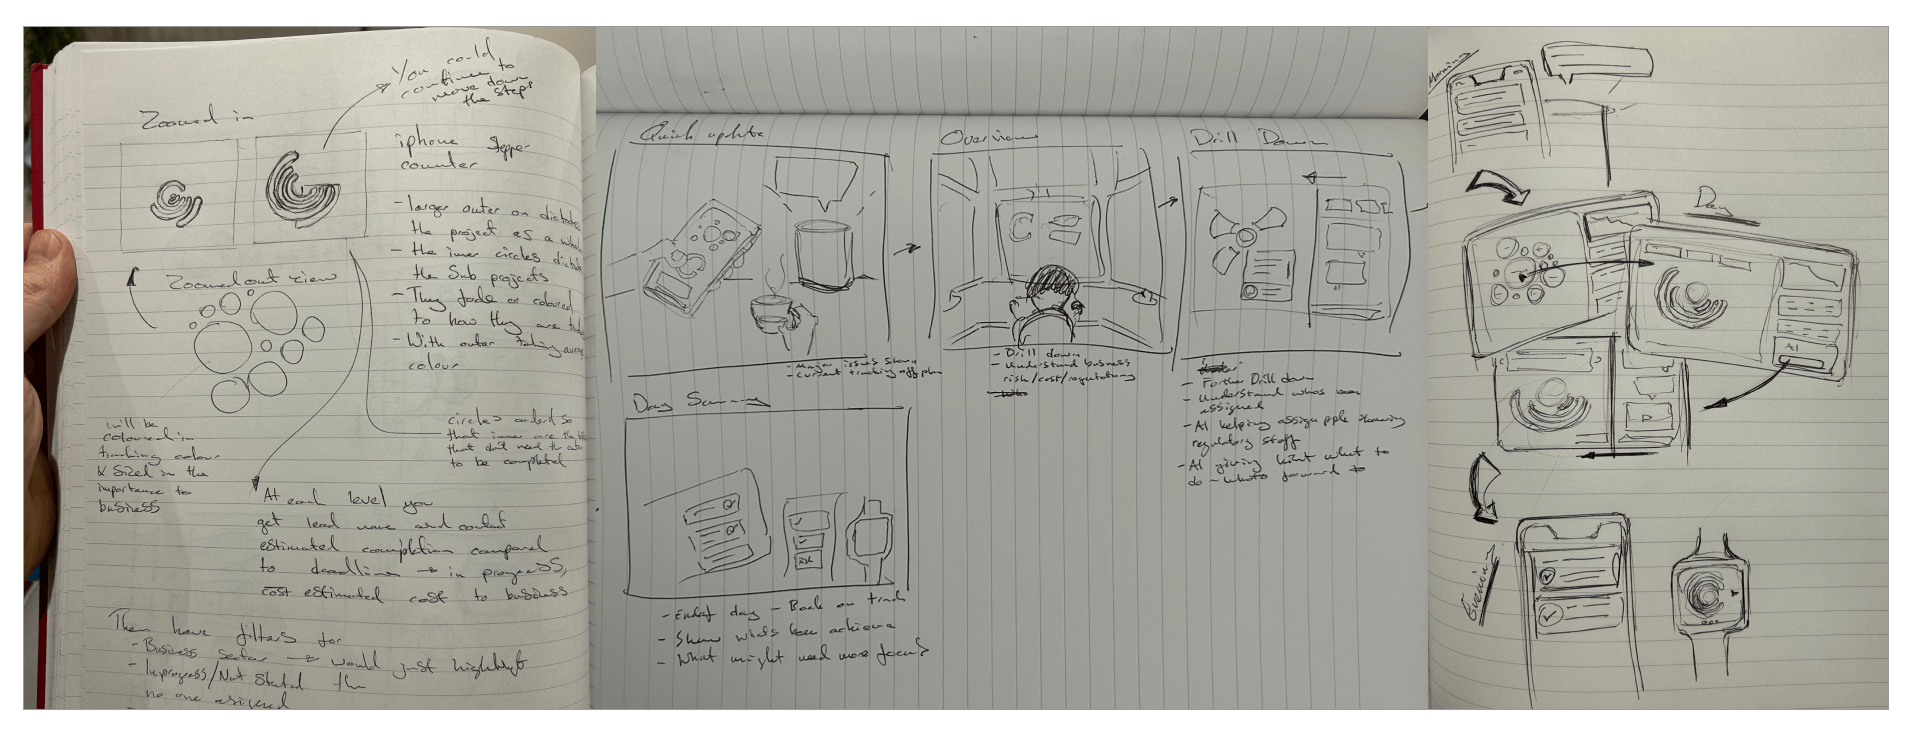
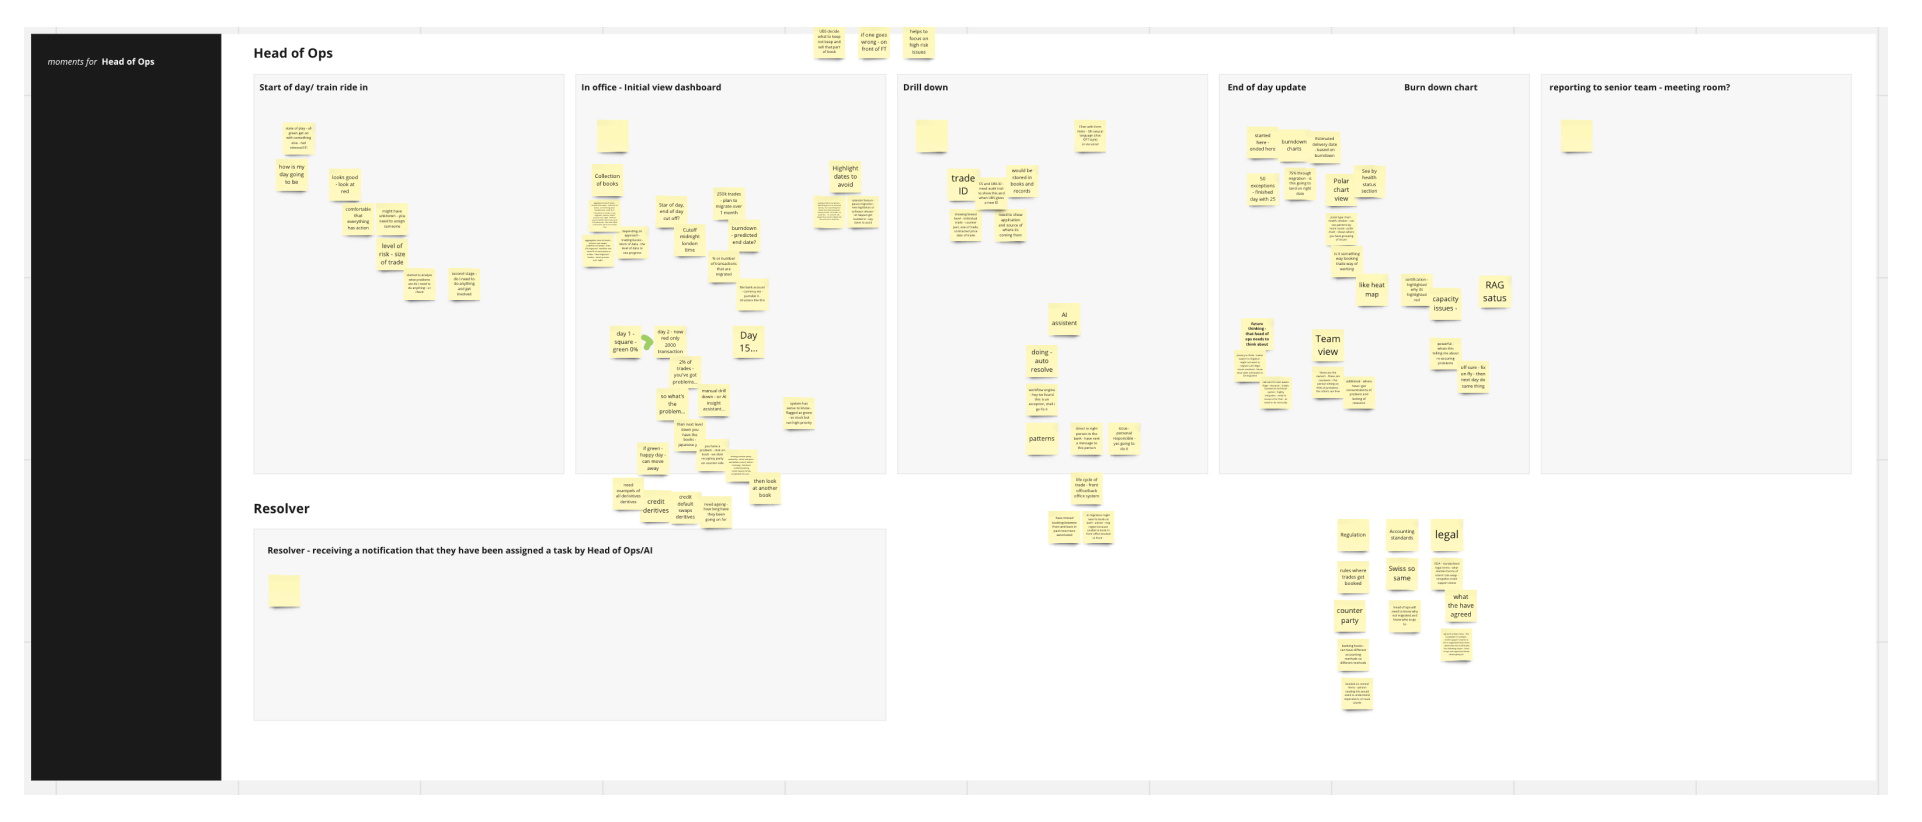
Sketching
Initial sketching to first create a narrative for the presentation of how a Operations Manager could use the tech available to help manage teh migration through the day. Then starting to look at how to best represent a visual dashboard to highlight a trade merger, that would both explain the story from one image, be workable but also understandable..
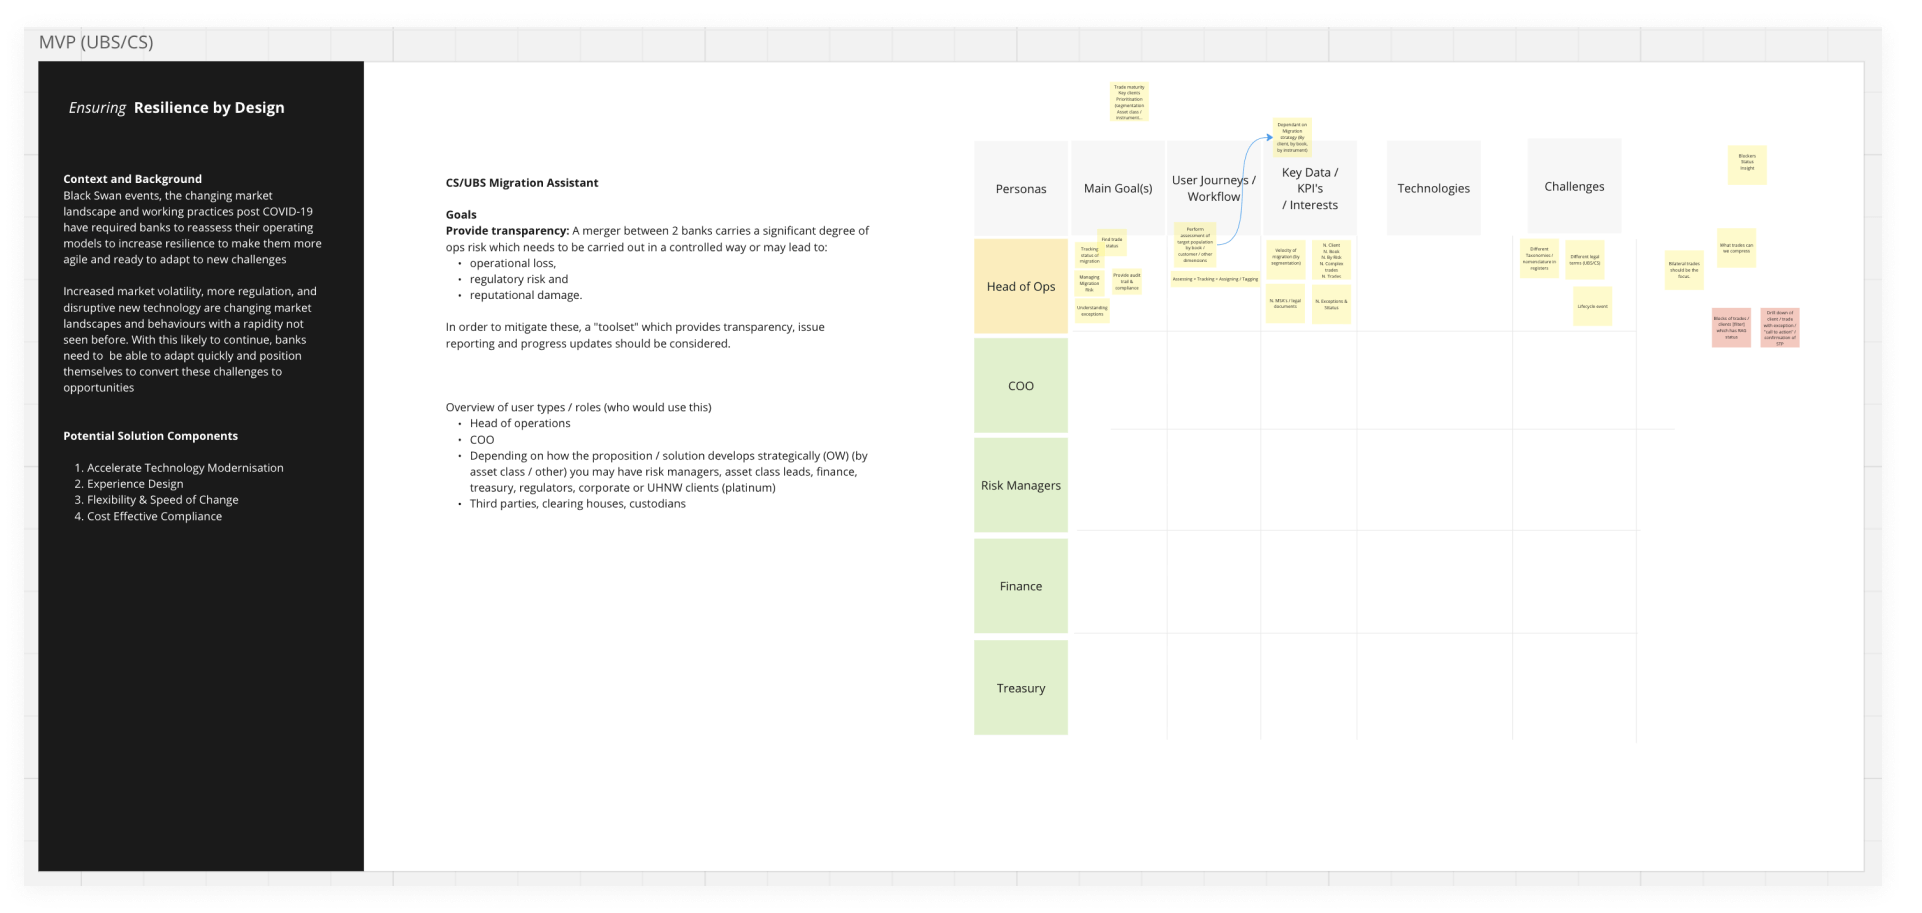
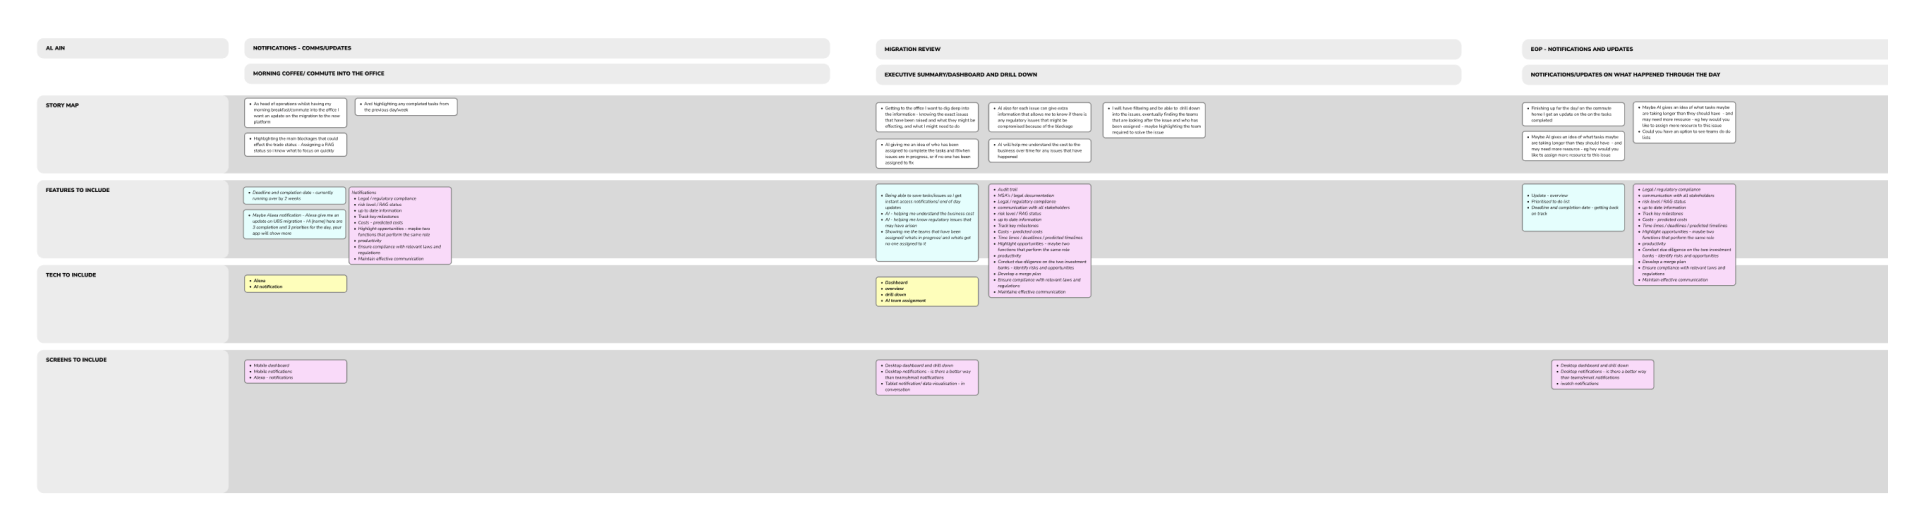
Journey map
Here I then set out a journey map, with the top swim lanes being focused on the story and narrative, with the next being focused on the features and tech to include and what screens might be needed. I then used this with teh sketches to relay back to the stake holders to confirm that they were happy with the thinking and to start to use as a brief for the wireframes.
Setting out the presentation
Workshops
Using the journey map to give an idea of what we were thinking, we sat down with the Key stakeholders and subject matter experts to understand what the Operations manager would be doing at every step of the process, so we could understand what they would need from a dashboard and what their day to day lives.
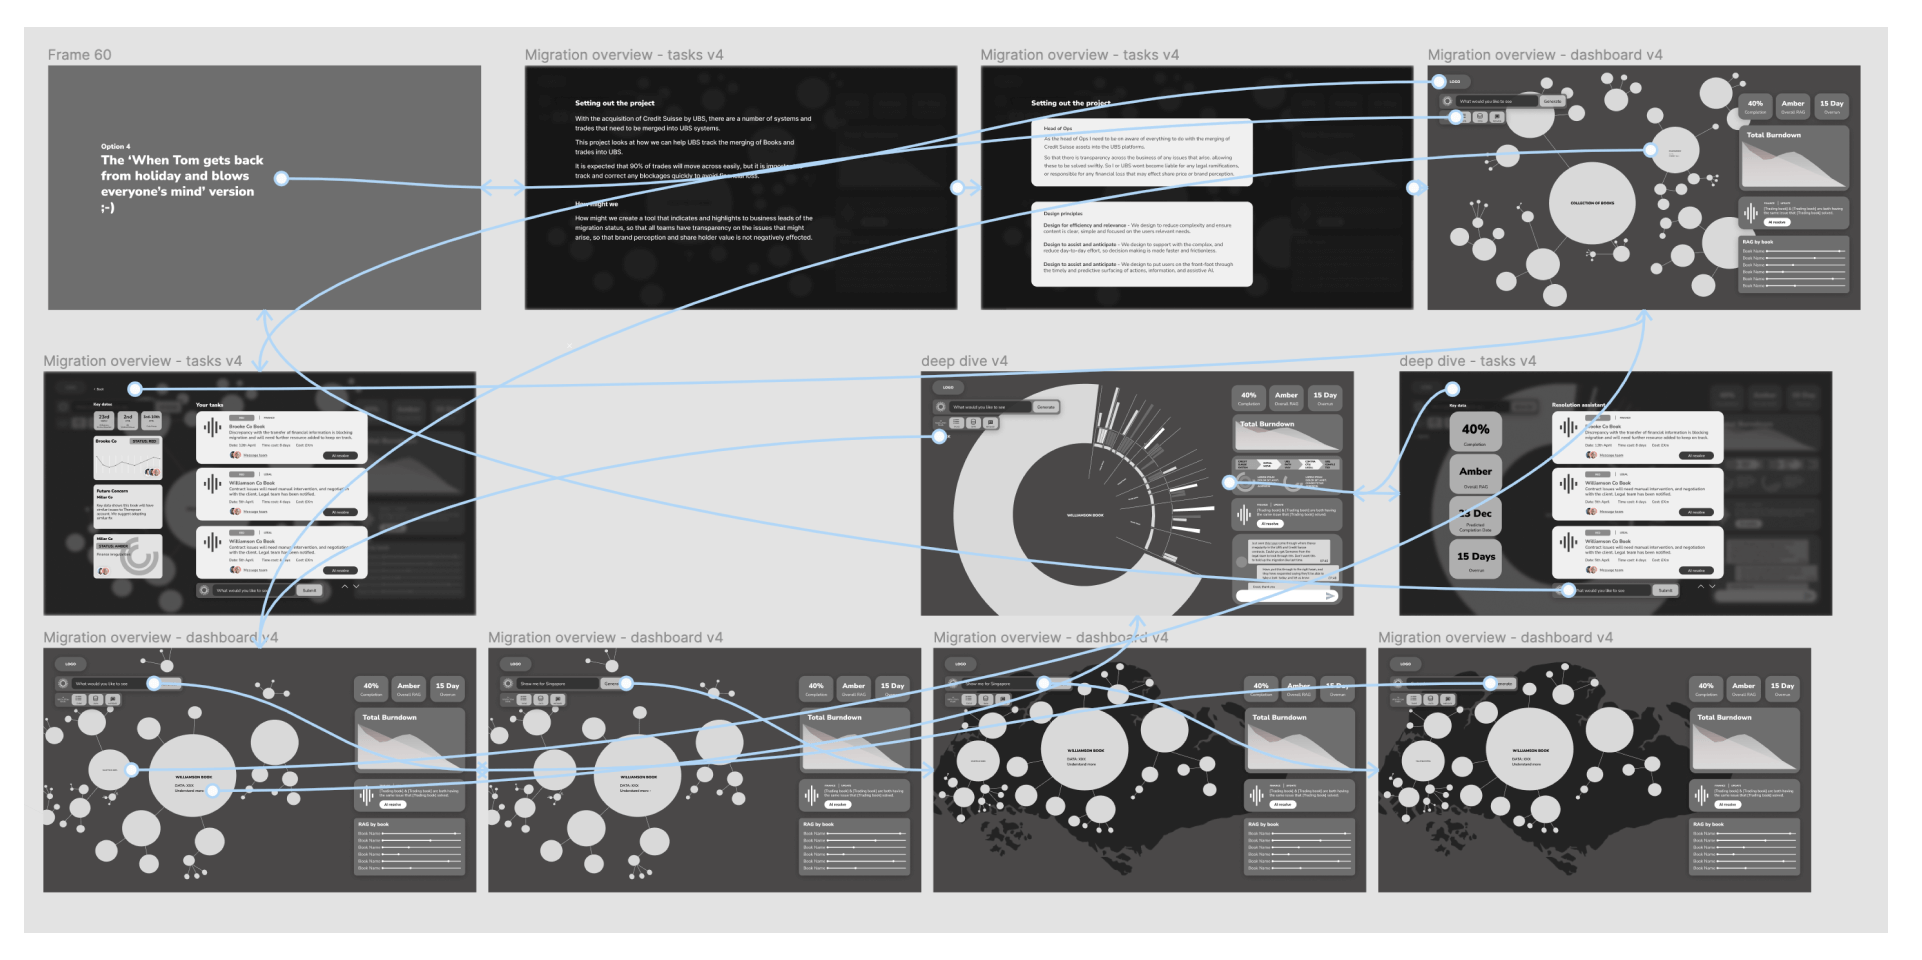
Straw man presentation
Before jumping into wireframing screens, we set out what might be required from a powerpoint presentation, and how we could tell the original narrative. This helped highlight what screens we needed, and when we might needed to focus on a couple of areas.
Setting out the presentation
Workshops
Creating a number of iterations where the wires meet the ask from the Finance VP’s but give options of ones that might be more focused on the user and might easily achievable in build, to ones that would create excitement and use the latest technology available to us.
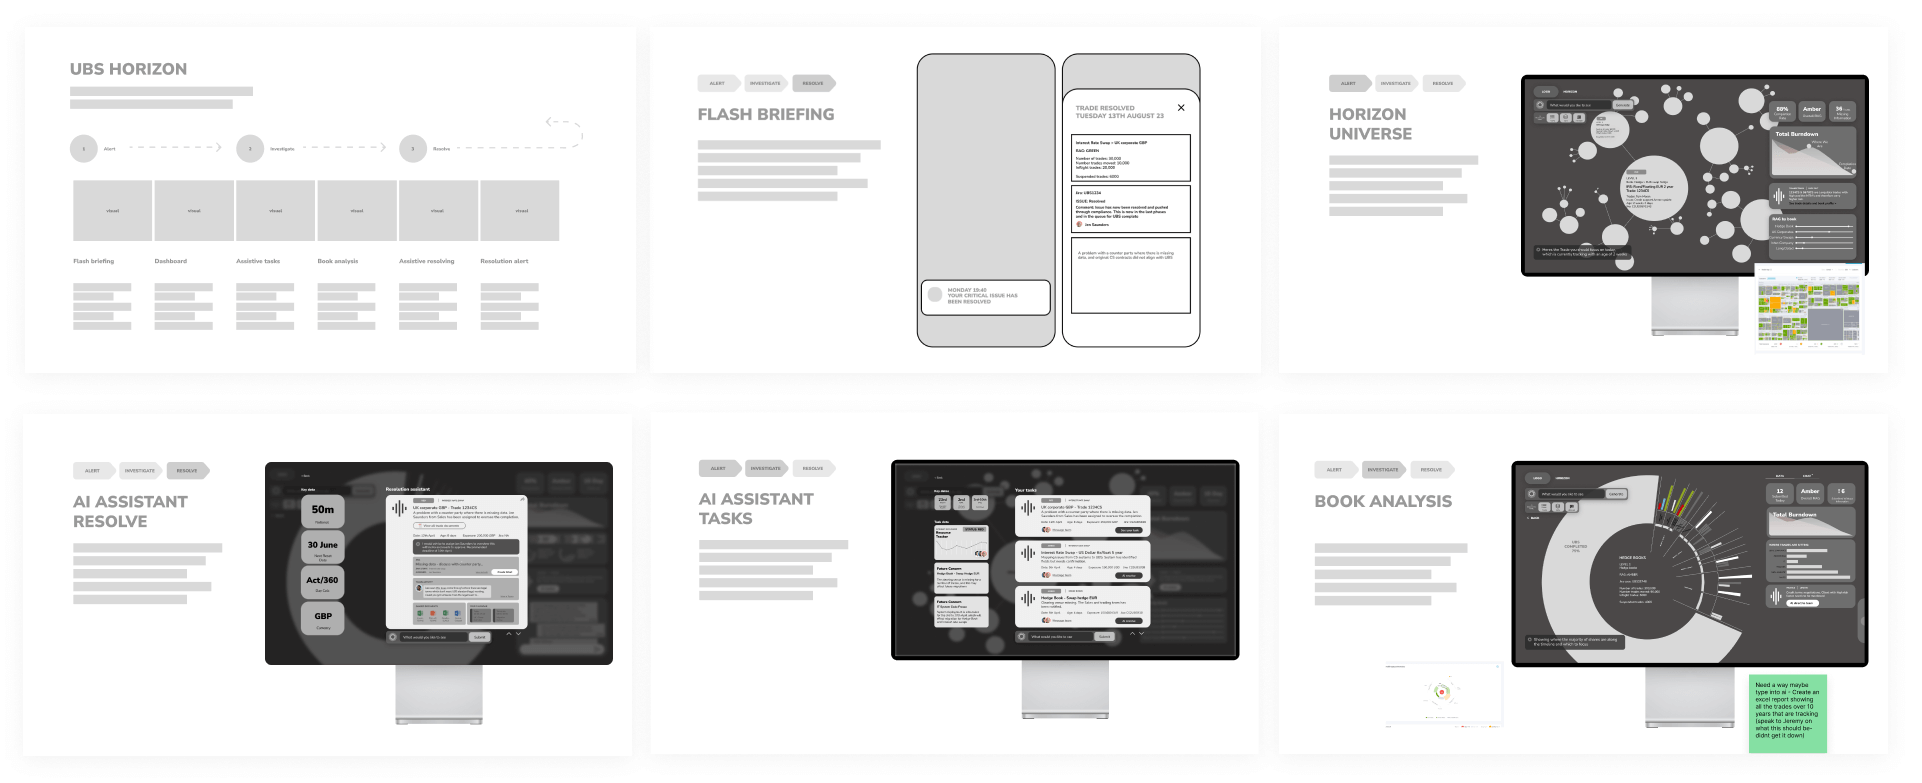
Prototype
Creating a prototype that would show how we could use an AI prompt to allow uses to manipulate the data they needed at any given time.
Presenting designs
Taking theses designs to the VP’s to get an idea of what they would been for their presentation. WIth the decision to go with the AI technology as this would allow to create excitement and allow for the finished UI designs to create more interest.
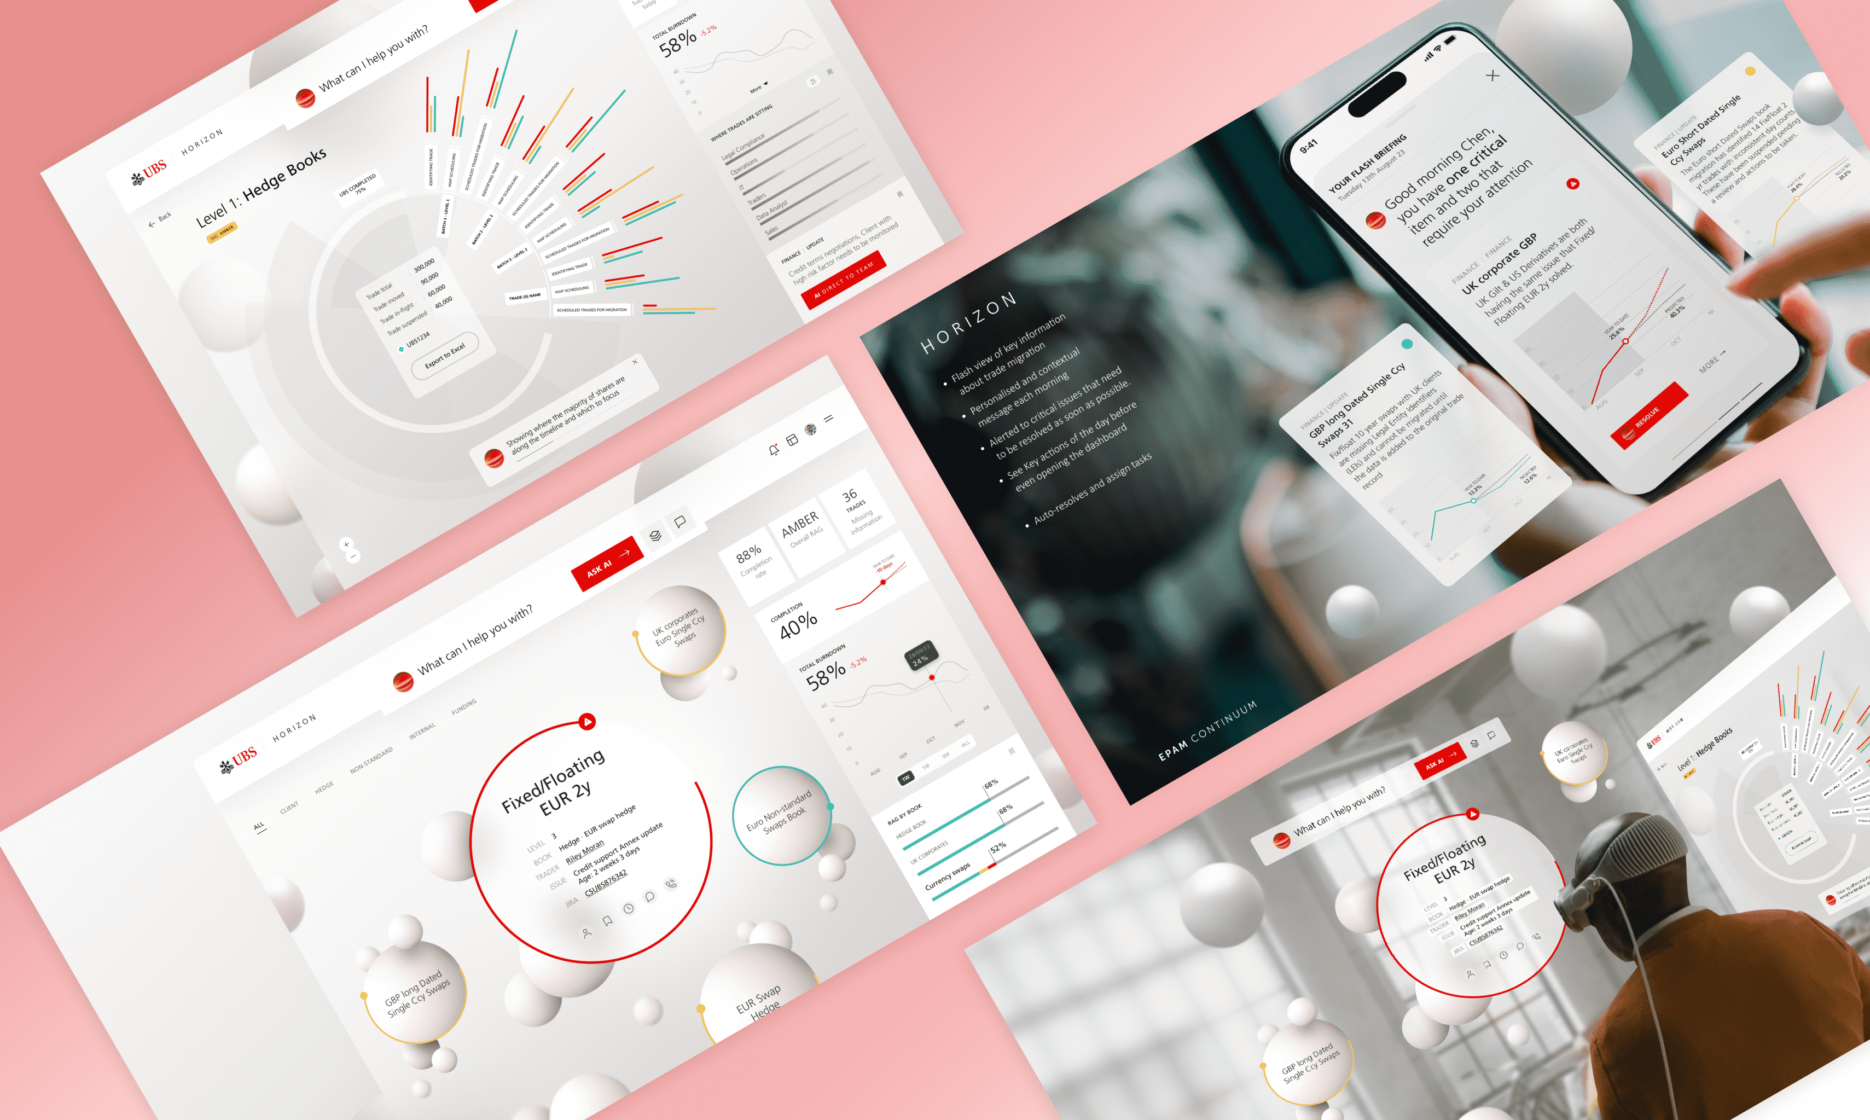
UI designs
Final slides
Once the UI designs were complete, again I sat down with the VP, to go through the language on each screen to make sure that the terminology was being used for the industry.